Table of Contents:
Campaigns Overview Snapshot Report
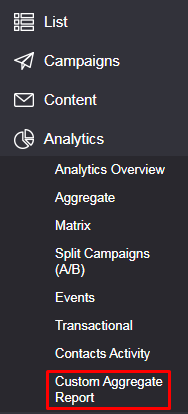
How can I see the campaign Snapshot report
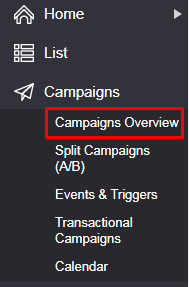
- The quickest way to get a quick overview of delivery and performance stats for a given campaign is from the the Campaigns → Campaigns Overview page.
- For "Completed" campaigns go to the 'Actions' column and click on the Snapshot Report icon.
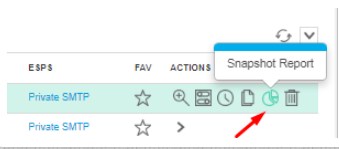
- A new pop-up window will appear showing an overview of that campaign's delivery and performance statistics.
- For a fully detailed report of campaign stats – see the Aggregate Report below.
Aggregate Report
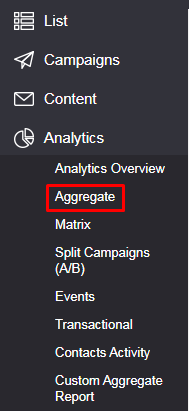
First and foremost, the Aggregate report provides a campaign level grouping analysis:
- You can see there your full email delivery stats funnel: sent, success to failed, hard bounces and soft bounces per campaign.
- You can also view all unsubscribed and complaints aggregated per campaign.
- Finally you can also view all behavioral performance stats including: opens, clicks along with any behavioral conversion points you might be using.
![]() Note: Due to Gmail caching image open stats could be lower that other ISP/Domains.
Note: Due to Gmail caching image open stats could be lower that other ISP/Domains.
Additional analytical groupings
- Per Day: shows delivery stats in per day grouping.
- Per Week: shows delivery stats in per week grouping.
 This grouping is good for identifying trends of soft bounce rates, open rates, hard bounce rates, unsubscribe rates, etc.
 - Per Month: shows delivery stats in per month grouping. This grouping is good for identifying trends of soft bounce rates, open rates, hard bounce rates, unsubscribe rates, etc.
- Per Country (Geo) stats: shows open and click stats grouped per country and continent
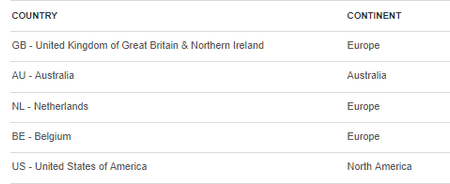
- Note: The information for each open (or click) is stored separately, if a contact clicked once from UK and once from FR, he will have two separate open entries and subsequently appear in both segments (UK openers and FR openers). Same goes for statistics.
- Note: Due to Gmail caching images, the open may appear under the location of their caching server (often in the US), and not where the email was actually opened.
- Per Browser stats: shows opens and clicks grouped by recipient browsers including mail clients like Apple Mail, Outlook, Chrome, IE, etc.
- Per OS stats: shows opens grouped by recipient operating system. E.g., Windows, MaxOSX, iOS, Android, WinPhone
- Per Tag: You can tag your emails with a label (similar to tags and labels you might find in: Gmail, Blog Posts, Photo Management software, etc. See here for more about Tags in general). You can then get stats across multiple campaigns using these tags.
- Per Link Group: If you're using Ongage Link Groups, then in this tab, you'll get an aggregated report showing all clicks per Link Group.
- Per Email Name / ID: Delivery (sent, success, bounces) and performance (opens, clicks) stats, grouped per email message name and email message id.
- Per Email Subject: Delivery (sent, success, bounces) and performance (opens, clicks) stats, grouped per email subject.
- Per From (Email) Address: Delivery (sent, success, bounces) and performance (opens, clicks) stats, grouped per from-name email address.
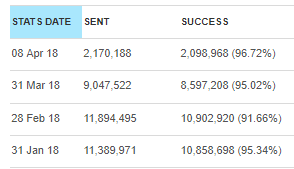
Date Filter in Ongage Analytics is Based on Stats Date
![]() Ongage Analytics date filters are by "Stats Date" (and not schedule date). So for example if you filter for the last 2 weeks in aggregate report, it will show all campaigns scheduled in last 2 weeks, as well as any campaign from earlier sent dates, that have accumulated new open, click, etc. stats, in the past 2 weeks. Those latter campaigns will have sent stats of 0.
Ongage Analytics date filters are by "Stats Date" (and not schedule date). So for example if you filter for the last 2 weeks in aggregate report, it will show all campaigns scheduled in last 2 weeks, as well as any campaign from earlier sent dates, that have accumulated new open, click, etc. stats, in the past 2 weeks. Those latter campaigns will have sent stats of 0.
Events Analytic Reports
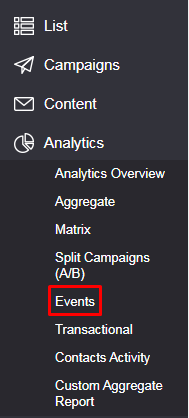
How to see statistics of Events mailing
Events statistics appear under the sub-menu of Analytics. Stats are grouped by specific events and for each event you can get a drill down report for each one of its triggers and trigger instances. You can analyze Event analytics by grouping them as First Level and Second Level using the following filters.
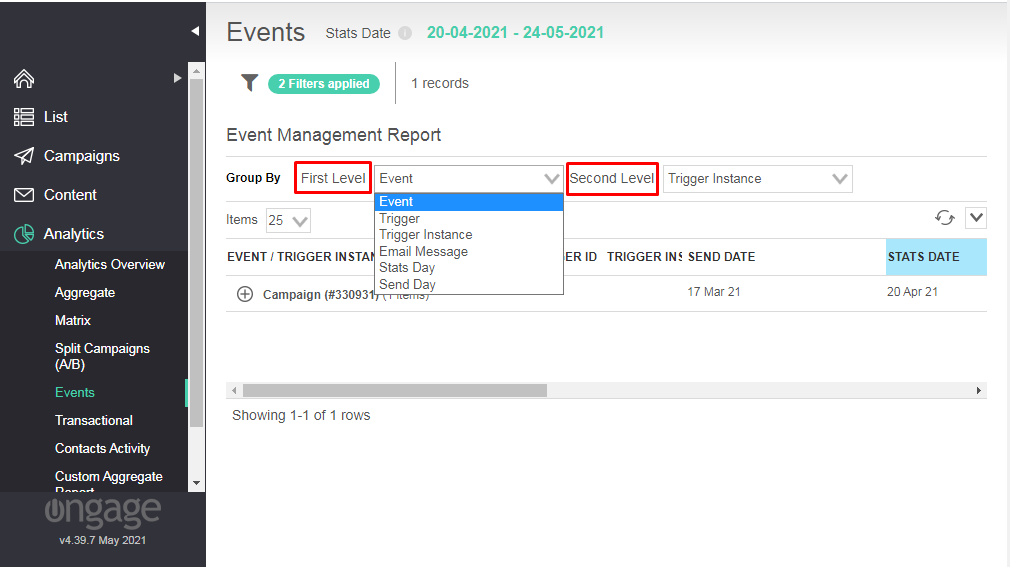
- Event: It is the Event ID that is visible in the UI.
- Trigger: It shows the associated Trigger ID.
- Trigger Instance: When each trigger is run, an instance of that trigger is generated which is known as Trigger Instance.
- Email Message: The message that is to be sent associated with the event.
- Stats Day: When you open the sent mail on a particular day, you will receive the stats for that day.
- Send Day: The day when the mail is sent.
Transactional Analytic Reports
![]()
How to see statistics of Transactional mailings
Transactional emails statistics appear in the transactional sub-menu under Analytics. You can review there the stats for all Transactional emails sent (including List welcome emails and other API transactional mailings).
How can I see ISP/Domain delivery stats for Transactional campaigns
Those can be viewed in the Matrix report (see below). The Campaign Filter allows you to filter the stats by:
- Regular campaigns
- Event campaigns
- Transactional campaigns
The Ongage Matrix Report
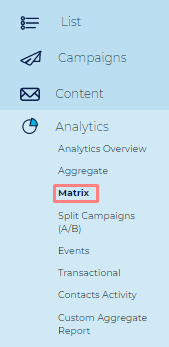
How can I see and optimize ISP/domain deliverability stats
- The ongage matrix report enables viewing email delivery and performance stats grouped by the ISP domains (aka Internet mailbox providers e.g., Gmail, Yahoo, AOL, Outlook.com) you sent to in your list.
- The report offers 2 views:
- Grouped by ESPs aka vendor connection.
- Grouped by the top Domain aka ISP/Mailbox provider.
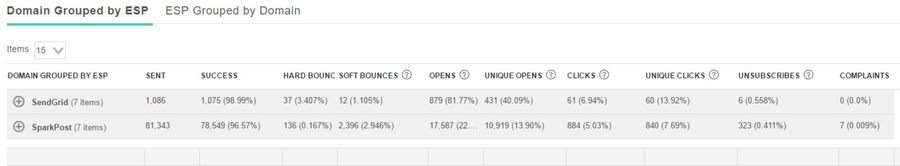
- Here you'll find delivery KPIs for the top largest 7 ISPs you're sending to. If you would like to see the full long tale, to go to the Custom Aggregate Report.
- The Ongage Matrix Report shows your email deliverability and performance per ESP/SMTP connection aka ECID.
- It allows email marketers to optimize their email marketing delivery and performance.
![]() Note: Due to Gmail caching image open stats could be lower that of other Mailbox Providers (aka ISPs).
Note: Due to Gmail caching image open stats could be lower that of other Mailbox Providers (aka ISPs).
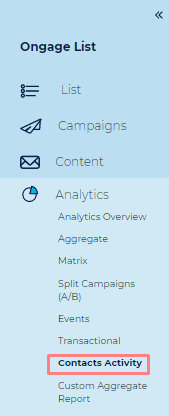
Contact Activity Report
Intro
Contact Activity Report
- Provides activity stats (sent, opens, clicks and more) for each contact (i.e., email address). So as opposed to the aggregate report above, these are stats for each contact!
- Choose a set of filters (time-frame, segment, campaign, field value, etc.) for the set of contacts you'd like to get in the resulting report and analyze their stats.
- For that set of contacts, you can see see how many email messages were sent, how many opens and clicks they performed.
- In the export detailed report, you can see exactly when each campaign was sent to each contact, and exactly when they performed each open and click, and on which link(s) they clicked on!
![]() Note: When you choose the campaign filter, it will only select contacts that participated in the selected campaign(s) and will provide stats only for those selected campaign(s) taking into account also the required time-frame filter.
Note: When you choose the campaign filter, it will only select contacts that participated in the selected campaign(s) and will provide stats only for those selected campaign(s) taking into account also the required time-frame filter.
Contact Activity Aggregated and Export Combined Detailed Report
- Create a report as described above and under the 'Report History' page you'll find the latest report you generated at the top of the list.
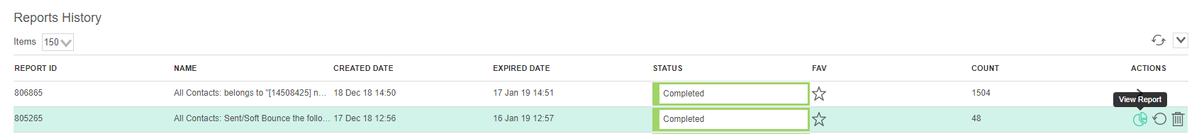
- Click on the 'View Report' (as seen in screenshot above) for an aggregated report with a summary of all sends, opens, clicks per contact, in the given stats time range you chose. Here you also find inactivation dates as well as last sent and last opened dates. Last but not least you can also edit contacts from this screen.
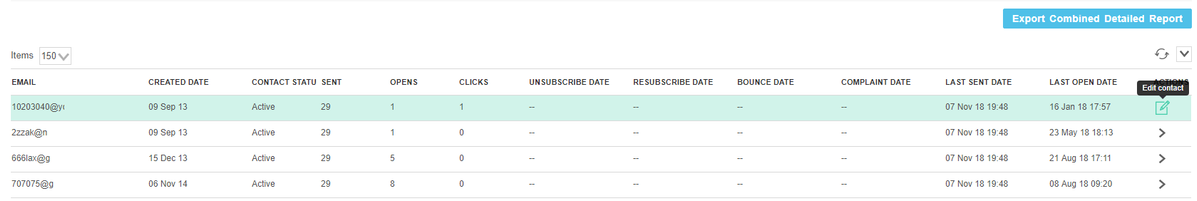
- To export the full detailed report for all contacts and all their activity (send / open / click / soft_bounce / hard_bounce / unsubscribe / complaint) click on the 'Export Combined Detailed Report' button.
Export Combined Detailed Report
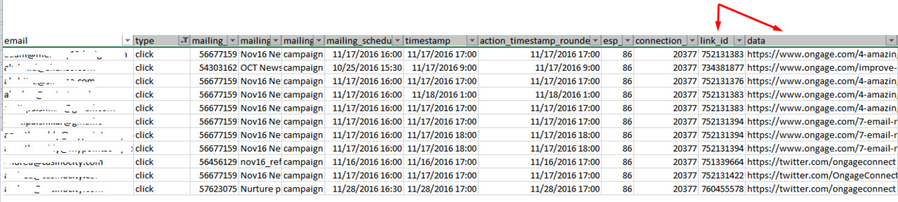
Following is an explanation of the columns you'll find in this export CSV:
- email: contact email address (self-explanatory)
- type: of activity. Can be any one of the following: send / open / click / soft_bounce / hard_bounce / unsubscribe / complaint / resubscribe.
- mailing_id: Ongage campaign ID AKA CID. In the case of Events this number is the campaign trigger instance id (aka mailing_instance_id).
- mailing_name: the name of the campaign associated with that CID. In the case of Events, this is the name of the Event.
- email_message_id: the message id sent in that campaign.
- mailing_type: campaign (regular bulk campaign), triggered (aka event), transactional.
- mailing_schedule: the time and date that the campaign was scheduled for.
- timestamp: deprecated
- action_timestamp_rounded: the rounded to the hour timestamp when the activity happened (send / open / click / soft_bounce / hard_bounce / unsubscribe / complaint). In case of Send this is the schedule date.
- esp_id: the unique numeric id that identifies the specific ESP/SMTP vendor in Ongage.
- connection_id: the ECID related to the activity type.
- link_id: the unique Ongage id related to the link of that particular click activity.
- data: the URL of the link
- days_passed: days passed from send date to open or click activity date
- ip: of open or click when available. This mapping is performed by means of an IP geolocation database.
- country_code: related to IP of open and click when available. This
- browser: from where open or click clicked occurred when available.
- os: of device where open or click clicked occurred when available.
Note: Timestamps in export CSV are UTC without user time zone offsetting.
How can I see which links did contacts click on
- Create a report as described above.
- Export the detailed report as described, and you'll get a CSV of that detailed report.
- Open the CSV in Excel or any Spreadsheet software, filter by 'type' 'click' and you can see exactly who clicked on which link, when and in which campaign:
Custom Aggregate Report
![]() The custom aggregate report is a powerful email marketing analysis report. It enables additional custom grouping, you won't find in the standard aggregate report described above. These groupings (or Pivots if you will), include:
The custom aggregate report is a powerful email marketing analysis report. It enables additional custom grouping, you won't find in the standard aggregate report described above. These groupings (or Pivots if you will), include:
- Grouped by List Field.
- Grouped by All Top Level ISP Domains (e.g., yahoo.com, gmail.com) you're sending to.
- This provides for a long-tail of email deliverability and performance analysis.
- So while the Matrix Report noted above, displays stats for the top 7, 8 ISP domains you're sending to, this reports provides the full long-tail of all ISP domains you're sending to.
- Grouped by All 2nd Level ISP Domains, e.g., yahoo.* for all yahoo domains .com, .uk, etc.
- Grouped by Campaign ID.
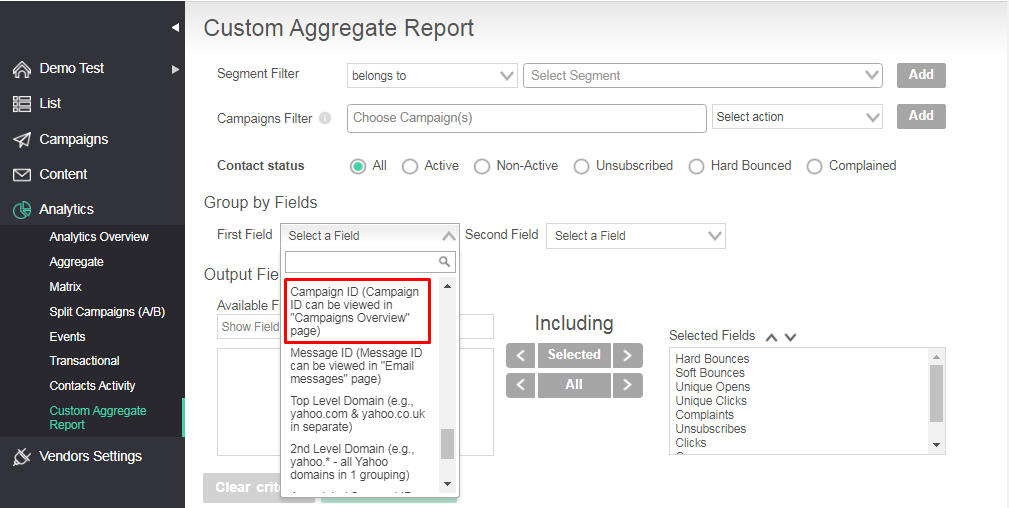
- Grouped by Email Message ID.
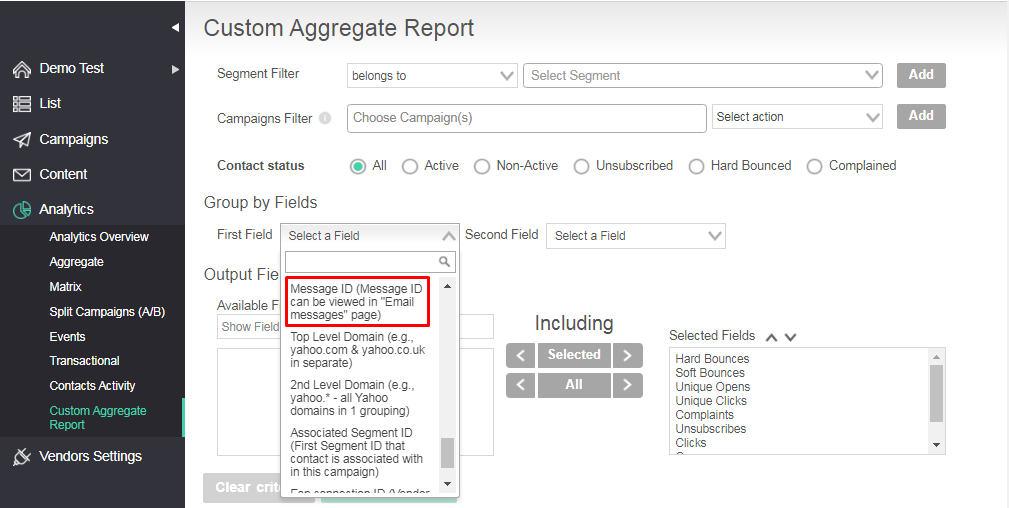
- Grouped by ESP Connection ID.
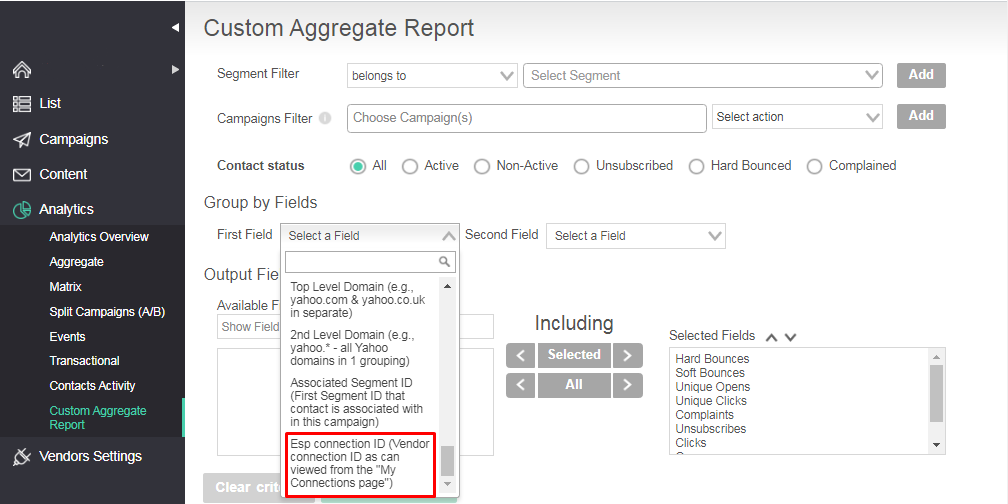
- This report also enables 2 grouping levels, so for example you can have grouping by State and by City.
List Field Grouping Usage Examples
- Let's say you have a list field called source, that indicates the source of each contact (aka lead). Let's say the values there are: SEO, AD WORDS, FACEBOOK, LINKEDIN.
- With this report you can then analyze open rates, soft bounce rates, click rates, unsub rates, per source. Enabling marketers to analyze which sources performs best/worst.
- Alternatively the source values could have been Affiliate IDs, enabling marketers to analyze which affiliate source performs best/worst.
- List Field state. If you capture the State value for each of your contacts, you can then compare delivery and behavioral performance analysis between different regions, and see which ones have the best/worst performance.
- If you also capture the city you can compare the performance of different cities grouped by state by using the double grouping feature.
- Any demographic data you might collect and want to compare delivery and engagement from Gender to Age, etc.
Ongage Stats Retrieval Time Intervals
Following are the time intervals that Ongage pulls email delivery stats (statistics) from the outbound ESP/SMTP:
- First hour – every 30 minutes
- 2-3 hours – every 60 minutes
- 4-6 hours – every 2.5 hours
- 7-24 hours – every 6 hours
- After that – once a day
![]() Ongage typically pulls all delivery stats (sent, success, failed, hard bounces, soft bounces, complaints) via API calls to the outbound ESP/SMTP plug-in connection.
Ongage typically pulls all delivery stats (sent, success, failed, hard bounces, soft bounces, complaints) via API calls to the outbound ESP/SMTP plug-in connection.
- Since not all stats may be readily available via the API, it may take a few hours till all those stats are retrieved and then processed and stored in Ongage.
- Moreover, the outbound ESP/SMTP might throttle sending rates to certain ISP mailboxes like Yahoo, Outlook, etc., for better deliverability, so it may take some time for all emails to get sent to those ISPs.
- Finally some trailing emails, can get deferred for up to 72 hours due to retries, so that final delivery stats can still come in up to 3 days later!
- Having said all of that, most stats will have come in, within the first several hours after the campaing was sent.
![]() Ongage stops retrieving campaign stats after 1 week. Having said that, behavioral data, and in particular soft bounces, hard bounces and complaints, are pushed to Ongage from the outbound ESP/SMTP, and can in theory still come in weeks later, and while they may not be reflected in the campaign stats, those contacts will correctly be marked as hard bounced and complained in Ongage, and their status will become inactive, meaning Ongage will automatically stop sending to them!
Ongage stops retrieving campaign stats after 1 week. Having said that, behavioral data, and in particular soft bounces, hard bounces and complaints, are pushed to Ongage from the outbound ESP/SMTP, and can in theory still come in weeks later, and while they may not be reflected in the campaign stats, those contacts will correctly be marked as hard bounced and complained in Ongage, and their status will become inactive, meaning Ongage will automatically stop sending to them!
Different stats retrieval model for following SMTPs
In Ongage, stats retrieval for the following SMTPs works in a different model:
- Amazon
- MySmtp
- Private SMTP
These vendors push stats to us, as opposed to the model above where we need to pull those stats in incremental intervals (as detailed above).
![]() Therefore with this latter set of SMTP vendors, the stats are updated continuously back into Ongage. Add to that, data processing time, which can take typically between 10-20 minutes.
Therefore with this latter set of SMTP vendors, the stats are updated continuously back into Ongage. Add to that, data processing time, which can take typically between 10-20 minutes.
Analytic Filters
How far back in time does Ongage store stats data
- Ongage stores stats data for up to 2 years.
- By default, the stats date filter only goes back 1 year. You'll need to speak to your account manager in order to enable searching data that is up to 2 years old. Depending on your package, more than one year may not be available.